
Carbon footprint is a snapshot at a given moment of all greenhouse gas (GHG) emissions of an organization.
And it is to measure this carbon footprint that several methodologies have been developed. In France, the most well-known is the Bilan Carbone® - hence the name carbon balance in everyday language to designate the measurement of the carbon footprint of an organization - but there is also the regulatory Greenhouse Gas Inventory (BEGES), the GHG Protocol or the ISO 14069 standard.
All these methodologies rely on the use of models to link the company's activity data with GHG emissions. These are calculation standards that have been developed in order to measure the carbon footprint.
This is therefore an estimate of the emissions associated with the company's activities. And estimation inevitably means uncertainty.
Where does the uncertainty in calculating the carbon footprint of a company come from? How is it measured? How is it integrated into our Sami platform? And how to interpret the uncertainty results? We explain everything in this article.
1. Uncertainty in measuring carbon emissions
1.1 What is uncertainty?
The uncertainty of the carbon footprint refers to the margin of error or imprecision of the estimate of the carbon footprint measurement compared to the actual value.
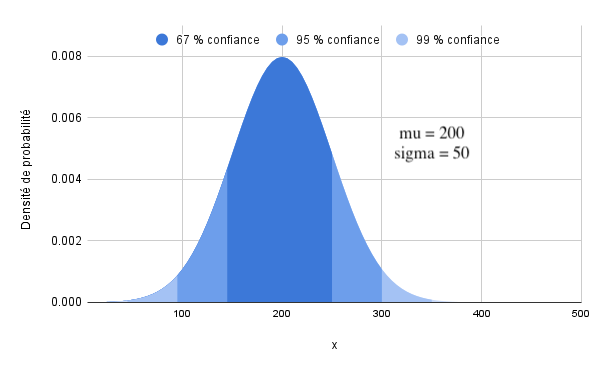
In general, uncertainty is given as a single value (for example 15%) or as an interval (-10% to +15%), for a given confidence level, often 95%. In other words, the probability of finding the actual value in the given interval is 95%.
- The smaller the uncertainty, the smaller this interval
- The greater the uncertainty, the wider the interval
1.2 Sources of uncertainty in calculating a carbon footprint
The carbon footprint of a company is obtained by aggregating all direct and indirect greenhouse gas emissions induced by the activity of this company.
And these emissions are calculated using the company's known and collected activity data (surface area, electricity consumption, etc.) to which an emission factor is associated in order to estimate the emissions induced by this activity data.
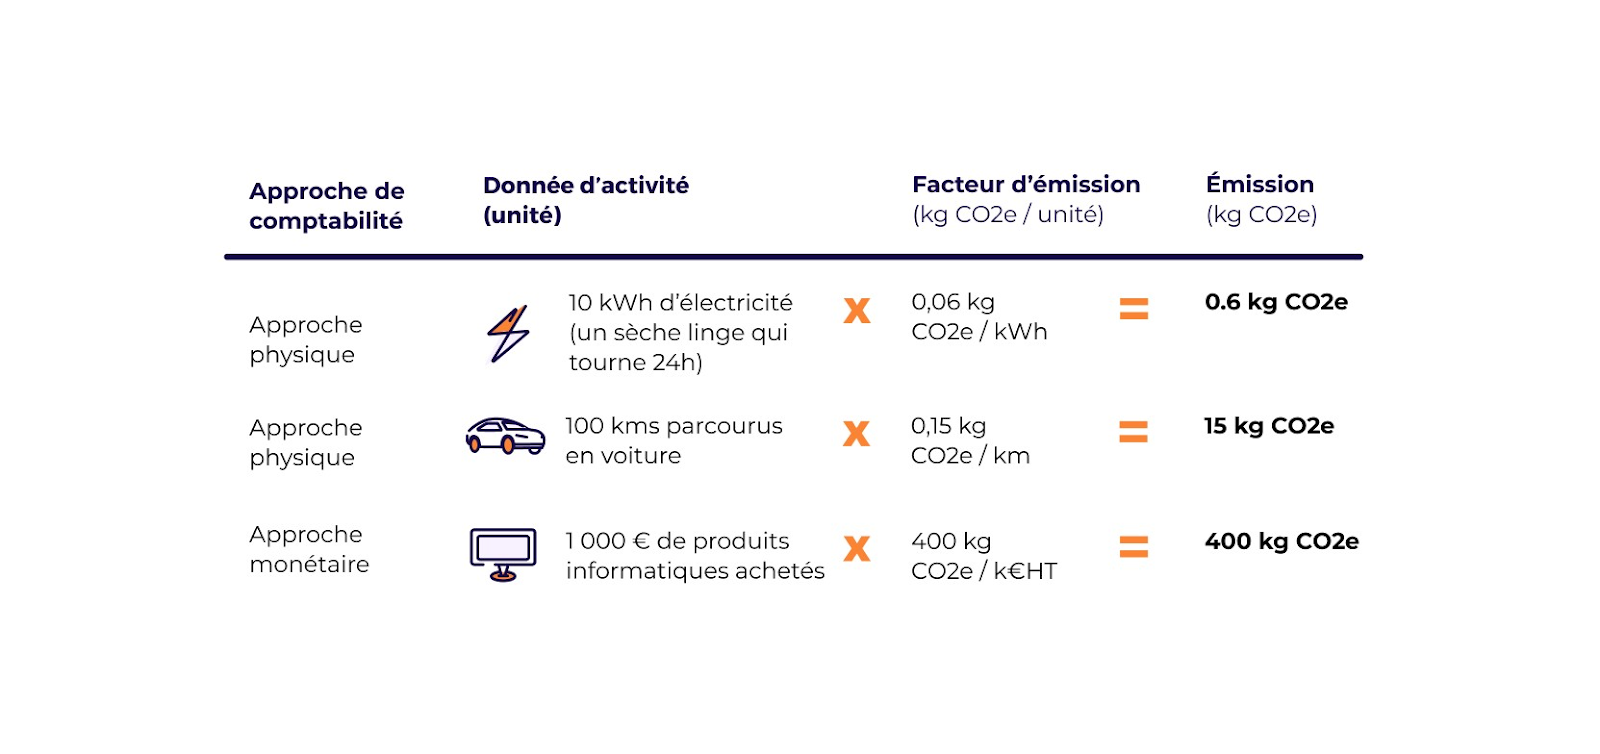
The uncertainty of each emission item therefore occurs both at the level of the activity data (an electricity consumption from a bill will for example be more precise than if it is estimated from the surface area) and at the level of the associated emission factor (the emissions induced by the combustion of a liter of gasoline are quite reliable while those induced by the production of a complex manufactured product will depend on a number of assumptions).
For each activity data and each emission factor, the sources of uncertainty are multiple:
- Lack of completeness: measurements or other data are not available, either because the process is not yet recognized, or because a measurement method does not yet exist, or simply because the data could not be collected.
- Lack of reliability: data is not measured (some assumptions are made to estimate it) or not verified (inducing measurement, reporting or transmission errors).
- Lack of temporal representativeness: data or the calculation of associated emissions are dated and may introduce a bias.
- Lack of geographical representativeness: there are data or emission factors but they are not specific to the study area.
- Lack of technological representativeness: emissions related to a specific process cannot be measured and the latter is modeled by another process, more or less similar.
Here is how the uncertainty is treated in detail for the two sources, the activity data and the emission factor.
1.2.1 Uncertainty around activity data
In order to facilitate the processing of balances, default uncertainty values have been defined for all activity data collected via the Sami collectors.
Activity data is often a combination of different user inputs as well as conversion factors. A default uncertainty has been assigned to each input and each conversion factor. These inputs can be grouped into 4 main categories:
- 0% uncertainty:
- Fixed or contractual parameters known: depreciation period, salaried working time, number of months of occupation of a premises, etc.
- Comprehensive tracked data: data from the FEC, for example.
- Data affecting only the categorization of emissions: share of vehicle use for each use, share of travel on each site, etc.
- Between 5% (measured, complete, up-to-date data, etc.) and 30% (slight extrapolation, estimation, adaptation) of uncertainty :
- Data consolidated by the company: number of equipment, unit weight, liters of gasoline in the fleet, electricity bill, etc.
- Reliable declarative data: home-to-work distance, number of publications, share of telework, etc.
- 30-50% of uncertainty :
- Moderately reliable declarative data: weight of vehicles, type of lunch meal regime, etc.
- Average assumptions: time spent on the site, parking area from the number of spaces, etc.
- >60% of uncertainty :
- Strong assumptions / high variability of data: refurbished device, annual consumption of an air conditioning, consumption based on the degree of insulation, etc.
- Unreliable declarative data
1.2.2 Uncertainty on the FE
The emission factors we use are derived from several databases.
Unfortunately, apart from the Empreinte® database of the Ademe, most of these databases do not communicate the uncertainty associated with the emission factors.
For the integration of uncertainty measurement on the Sami platform, we distinguish three sources of FE :
FE from the Empreinte® database with an uncertainty
We have taken over the uncertainty associated with it with a few differences. Some uncertainties have been slightly inflated due to their age (lack of temporal representativeness): this is notably the case for all monetary ratios and the FE of electricity whose methodology used (average over 4 years) introduces a significant uncertainty compared to the reporting year.
FE in Sami collectors
These emission factors (about 1000) are used for a large part of the assessments carried out on the platform. The uncertainties of these FE have been determined as accurately as possible :
- from indicators on the quality of the data if available
- by observing the variability of similar FE in other databases or articles or by reviewing the sensitivity analysis of the study from which the FE is extracted
- by drawing inspiration from the uncertainties of the Empreinte® database for similar categories of products/services in other databases
- as a last resort by basing on internal expert opinions based on knowledge of the industry
Other FE
For the other emission factors present in our consolidated database, uncertainties are gradually added.
- from the emission category by drawing inspiration from the Pedigree Matrix
- from the specificity of the FE (for example individual, collective declaration, default on INIES)
2. How to measure uncertainty?
Uncertainty is most generally described by a normal or log-normal distribution law.
We have decided to implement a normal law in the application which is more intuitive and easier to handle and manipulate. Moreover, the Empreinte® database, one of the few databases to specify the uncertainty of its emission factors, provides them in the form of a normal law.
2.1 Uncertainty aggregation formulas
In the Sami application, the uncertainty of an emission line is calculated using the uncertainties on the activity data and the FE. To obtain the total uncertainty of the assessment, it is then necessary to aggregate the uncertainties of all the emission lines.
The uncertainty of a data resulting from a sum or a product is calculated using two mathematical formulas :
- For each emission line, the activity data is multiplied by the associated emission factor. The uncertainty of an emission line is therefore given by the following formula :
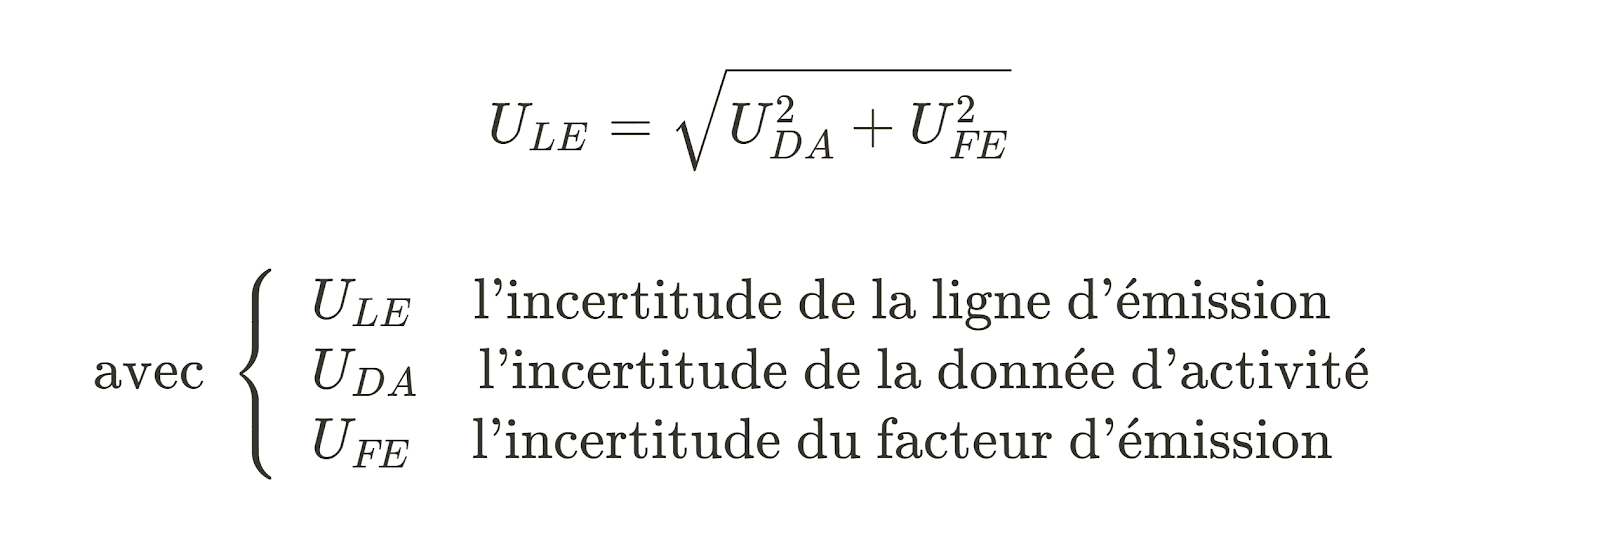
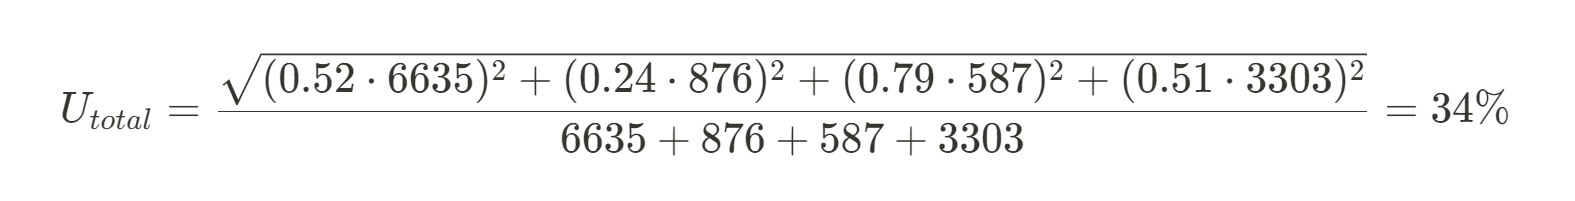
- For the final balance, we sum the emissions of each line. The overall uncertainty of the balance is obtained with the following formula:

2.2 Practical Application: An Example of Uncertainty Calculation on Emission Lines
Take, for example, this group of four emission lines:
| Data | Unit | FE (kgCO2e/unit) | Emissions (kgCO2e) | Data uncertainty | FE uncertainty | Total uncertainty |
|---|---|---|---|---|---|---|
| 684 | kg | 9.7 | 6635 | 0.14 | 0.5 | 0.52 |
| 148.5 | kg | 5.9 | 876 | 0.14 | 0.2 | 0.24 |
| 5000 | t.km | 0.12 | 587 | 0.36 | 0.7 | 0.79 |
| 6475.9 | meal | 0.51 | 3303 | 0.1 | 0.5 | 0.51 |
| Total | / | / | 11401 | / | / | 0.34 |
Thus, the uncertainty of the first emission line (product of the activity data and the FE) is given by the following formula:
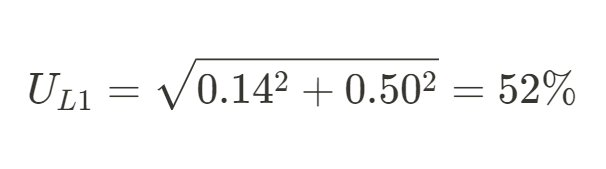
The same applies to calculating the uncertainty of the other emission lines. Then, the aggregated uncertainty of these 4 emission lines (sum of the 4 emissions) is given by the following formula:
3. Integrating Uncertainty Calculation in the Sami Platform
3.1 Intermediate Uncertainties at Various Collection Points
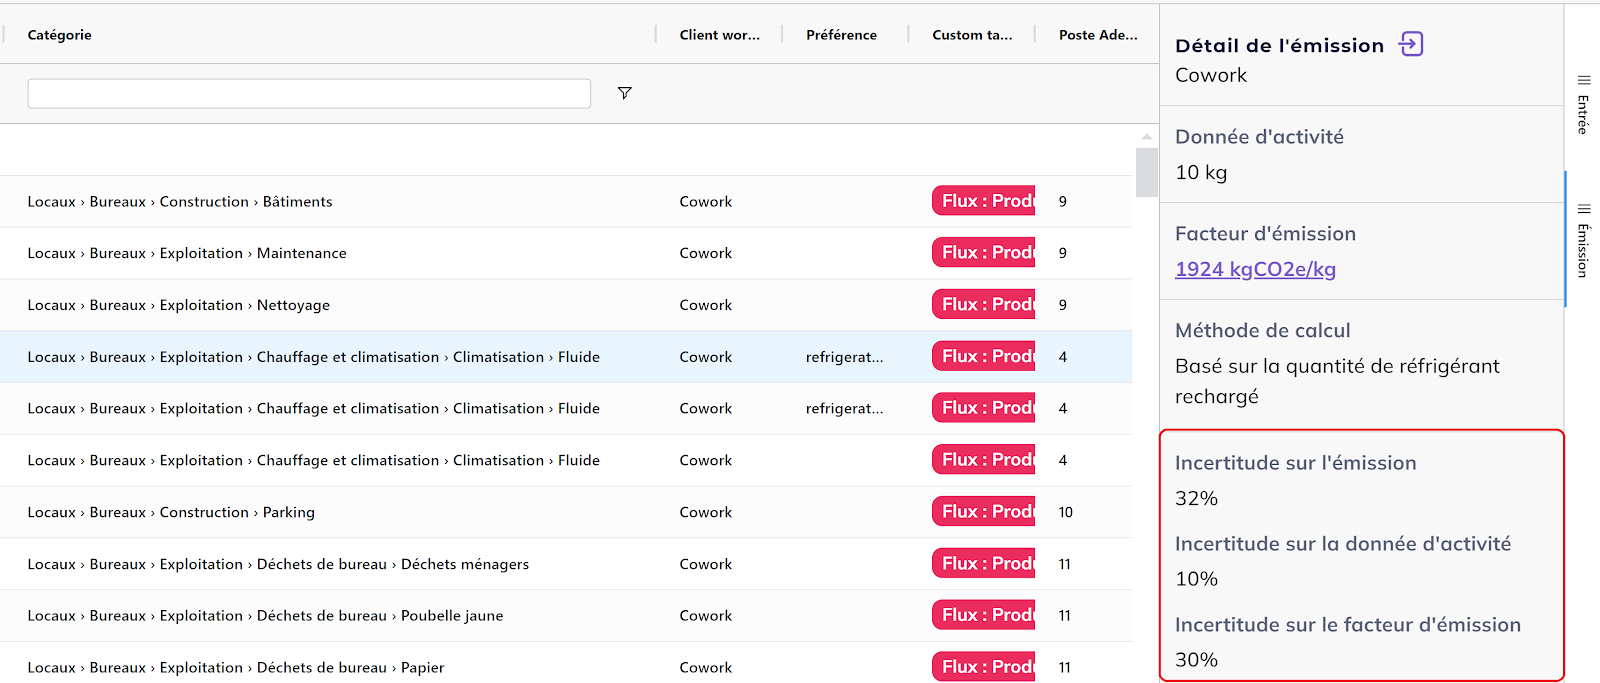
In the Sami form collectors, uncertainties on the emission factor and on the activity data are automatically applied according to the rules previously explained. The details of the applied uncertainties are available in each collector and can be modified in the consolidation.
3.2 Overall Uncertainty of the Balance in the Application
We calculate the overall uncertainty of the balance only if all significant emissions are covered by an uncertainty, but we do not impose full coverage. Indeed, the overall uncertainty of the balance will be highly dependent on the most representative emission items of the balance and, conversely, very little dependent on the minor emission items. Thus, the overall uncertainty can be assessed even if the minor emission items do not have an uncertainty provided.
The total uncertainty is presented in the summary of the carbon footprint results.

4. How to Interpret the Uncertainty of a CF and How to Reduce It?
Different indicators can be considered for the interpretation of the uncertainty.
- The overall uncertainty of the balance is a first indicator of the quality of the carbon footprint
- Low (<15%): The actual impact of the company is close to the estimated evaluation.
- Moderate (between 15% and 30%): The carbon footprint estimate gives a good order of magnitude of the company's actual impact, but it is necessary to identify which emission items inflate the uncertainty and how to obtain more precise data on these items
- High (>30%): The results of the carbon footprint should be taken with a grain of salt. The company must make efforts to better know, track, and consolidate its activity data internally. If the impact mainly comes from suppliers, it is important to engage in discussions with them to improve product traceability and composition.
- The type of data and emission factors used is another indicator to consider
- The percentage of physical and monetary data.
- The percentage of specific, semi-specific, or generic data
To reduce uncertainty, the company can set objectives on a minimum percentage of physical or specific data in the coming years and carry out LCA on its best-selling products in order to refine the precision of the measurement of the environmental footprint.
{{newsletter-blog-3}}
Other resources about the carbon footprint:
- the General Carbon Plan
- Understand everything about the carbon footprint
- The carbon footprint, an economic performance tool
- Analytical carbon accounting: making the carbon footprint a strategic tool
- Understand everything about emission factors
Mission Décarbonation
Don't miss the latest climate news and stay ahead of regulatory changes


.avif)
.avif)
Les commentaires